Data List and Statistics Views
The Data List and Statistics views are designed for simple runtime debugging of component ports.
To open the Data List view, right-click a port of a started component.
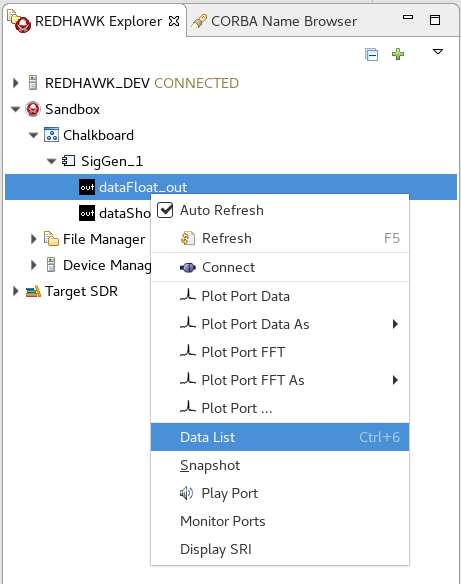
From the context menu, select Data List.
The Data List view is opened:
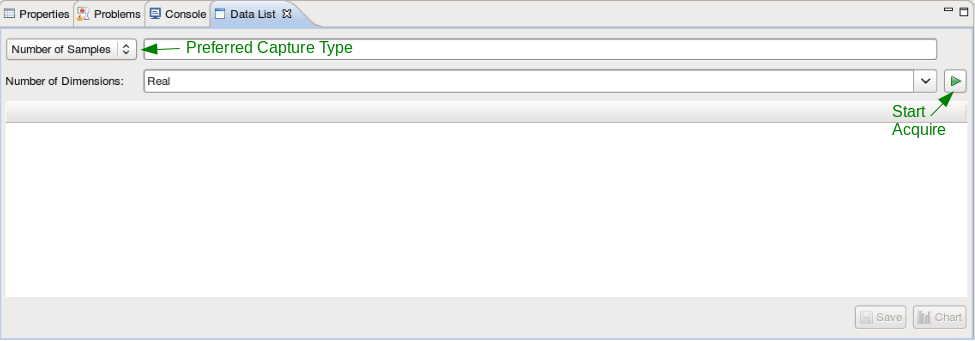
Select the preferred capture type:
- Number of Samples: Select a sample size
- Indefinitely: Collect until the user stops the process.
Select the Number of Dimensions of the sample data:
- Real
- Complex
- any positive integer number of dimensions
Click Start Acquire.
After all desired samples have been acquired and displayed in the Data List table, two additional options are displayed:
- Save
- Chart
To open a wizard and write the data to a Midas BLUE file or a binary file, click Save.
To open the Statistics view, which features a histogram and basic statistics of the sample data, click Chart:
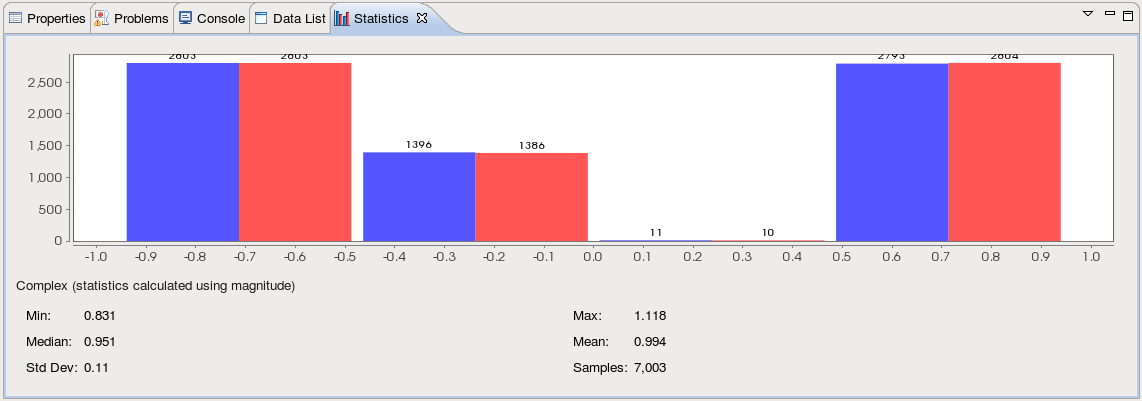
There are two ways to change the dimensions displayed in the Statistics view:
- In the Data List view, click the column headers.
In the Statistics view, from the View menu, select Settings. This opens the Chart Options dialog. In the Chart Options dialog, change the categories displayed in the chart:
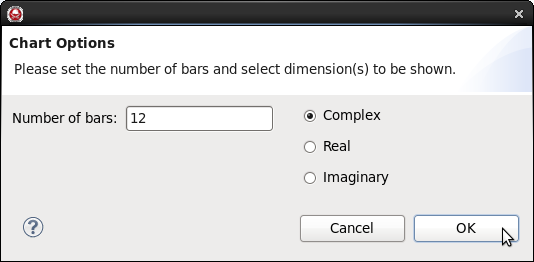
The chart and basic statistics refresh with each new collection of data in the Data List view.