IDE Quickstart
This section provides a simple example of the REDHAWK signal processing development environment, though it is far from a comprehensive guide to all of the features available in the REDHAWK IDE. While this guide assumes the user has no prior knowledge of the REDHAWK Core Framework, certain concepts and skills are required to fully understand the material.
The minimum technical requirements include:
- Object-oriented programming experience
- Linux/Unix experience
- Engineering/Computer Science background
- Understanding of basic communication theory
In addition to the minimum set of technical requirements, the following prerequisites must be met before beginning the following procedure:
- REDHAWK Core Framework and IDE installed
- Example components installed:
- SigGen
- HardLimit
Basic IDE Use
The following sections discuss how to launch the REDHAWK IDE, how to open the Chalkboard, how to create a signal generator, and how to test the input/output response of a component.
Launching the REDHAWK IDE
Start the REDHAWK IDE with the following command:
rhideIf prompted to specify a workspace location, select an appropriate location and select OK.
Opening the Chalkboard
From the REDHAWK Explorer view expand Sandbox, and double-click Chalkboard.
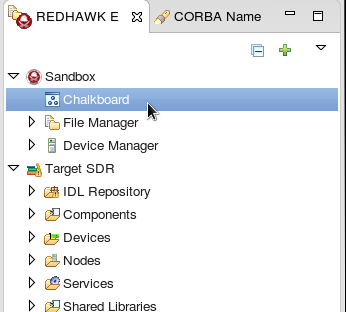
Chalkboard
Creating a Signal Generator
From the Chalkboard Palette, drag the SigGen (python) component into the Chalkboard canvas.
- In the Palette, if the SigGen component is not displayed, under Components, left-click the rh folder to display the list of available components.
- If the Python implementation is not displayed, expand the list of implementations by left-clicking the arrow to the left of the component name. After the list is displayed, left-click the desired implementation.
- When the component is finished loading, its background color is blue.
Right-click the SigGen component, and click Start.
Right-click the SigGen component, and click Show Properties.
From the Properties view, change the frequency to 20Hz.
From the Properties view, change the magnitude to 1.
Right-click SigGen’s dataFloat_out port, and click Plot Port Data.
Right-click the SigGen component, and click Stop.
Testing the Input/Output Response of a Component
From the Chalkboard Palette, drag the HardLimit (python) component into the Chalkboard canvas.
- In the Palette, if the HardLimit component is not displayed, under Components, left-click the rh folder to display the list of available components.
- If the Python implementation is not displayed, expand the list of implementations by left-clicking the arrow to the left of the component name. After the list is displayed, left-click the desired implementation.
- When the component is finished loading, its background color is blue.
Click-and-drag from SigGen’s dataFloat_out port to the HardLimit dataFloat_in port.
Right-click the SigGen component, and click Start.
Right-click the HardLimit component, and click Start.
Right-click the HardLimit’s dataFloat_out port, and click Plot Port Data.
Two Plot Port views are now open, one for each of the plotted ports.
Right-click the SigGen component, and click Show Properties.
From the Properties view, change the magnitude to 5.
The Plot Port view for the HardLimit dataFloat_out port is now limiting the output to 1.